Key Takeaways
- 170 Yaletown townhouses have sold since January 2019 — averaging about 22 sales a year, but ranging from a peak of 41 in 2021 to just 12 through the first eight months of 2026. This is a small, scarce housing type: a fraction of the volume the broader Yaletown condo market sees.
- Median sold price is $1,440,000 in 2026, down 21% from the 2023 peak of $1,825,500, and down 5% from 2019’s $1,521,500.
- Price per square foot has fallen 24% from its 2023 peak ($1,321 → $1,003), and is down 11% since 2019.
- Monthly strata/maintenance fees are up 45% since 2019 (average $827 → $1,196) — a real, growing carrying cost.
- Sold-to-list price ratio has held in a tight 95–98% band every single year since 2019 — townhouses haven’t seen the price swings condos have, a sign of persistent scarcity-driven demand.
- 11 active listings right now are sitting a median 94 days — more than triple the market’s historical 27-day median — and are priced about 21% above what’s actually been closing in the last 12 months.
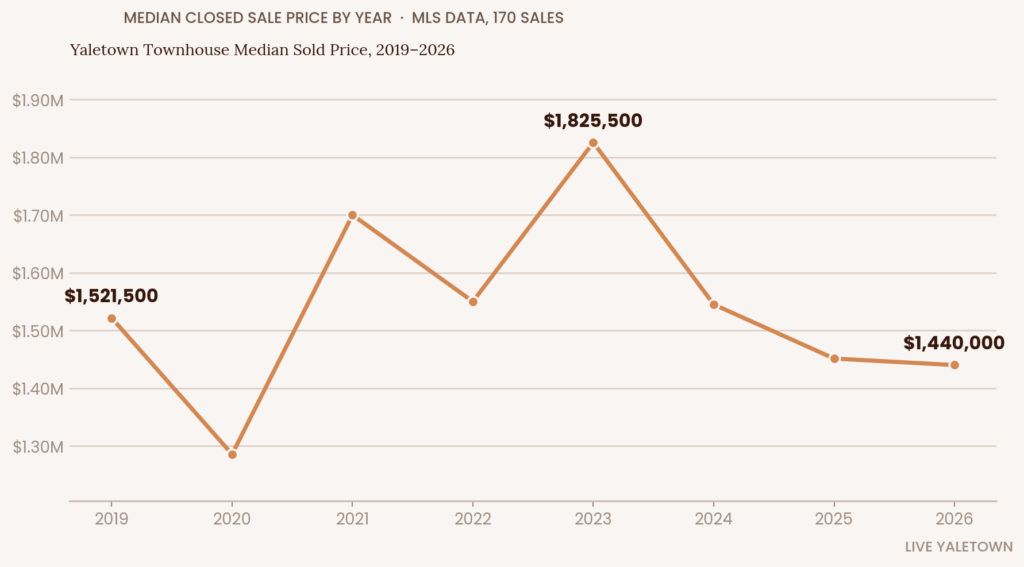
Median sold price for Yaletown townhouses, 2019–2026 — down 21% from its 2023 peak, but only 5% below 2019 levels.
Median sold price peaked in 2023 and has come down 21% since — but is only 5% below 2019 levels.
What Counts as a “Yaletown Townhouse”?
Yaletown’s townhouses are a distinct, small category within the neighbourhood’s resale market — ground-oriented or mews-facing homes built alongside (and sometimes literally underneath) the taller Concord Pacific towers that define the area. Most were built between 1992 and 2011 as part of Yaletown’s original master-planned redevelopment; a handful of the oldest stock (Beach Avenue, Hornby Street) predates that wave.
Unlike the highrise condo towers that make up most of Yaletown’s inventory, townhouses here are architecturally varied — everything from modest two-bedroom mews homes to sprawling multi-level waterfront residences with private rooftop decks. What they share is scarcity: 170 sales over nearly eight years works out to roughly one sale every 17 days across the entire sub-area — this is not a market where “comparable sales” are ever abundant.
Where They Are: Streets & Corridors
| Street | Sales (2019–2026) | Median Sold | Median $/sqft | Median Strata Fee | Median Year Built |
|---|---|---|---|---|---|
| Marinaside Crescent | 42 | $2,125,000 | $1,387 | $1,092 | 1999 |
| Homer Street | 27 | $1,335,000 | $1,049 | $671 | 2006 |
| Richards Street | 20 | $1,197,500 | $1,093 | $614 | 2003 |
| Howe Street | 12 | $1,542,500 | $1,122 | $1,032 | 2007 |
| Beach Crescent | 10 | $3,158,000 | $1,397 | $1,642 | 2005 |
| Beach Avenue | 6 | $1,171,944 | $1,071 | $651 | 1993 |
| Smithe Street | 6 | $1,117,500 | $864 | $710 | 2007 |
| Expo Boulevard | 6 | $1,767,500 | $1,106 | $1,042 | 1997 |
| Cooperage Way | 5 | $1,515,000 | $1,127 | $784 | 2008 |
| Beatty Street | 5 | $1,285,000 | $1,161 | $855 | 2005 |
| Hornby Street | 5 | $1,440,000 | $902 | $903 | 1994 |
| Aquarius Mews | 4 | $1,447,250 | $1,113 | $783 | 2000 |
A few smaller mews streets — Homer Mews, Kinghorne Mews, Smithe Mews, Seymour Mews — see only one to four sales apiece, but punch well above their size: this is where several of the highest-ever townhouse sales in Yaletown happened (more below). Treat medians on these streets as directional, not statistically firm, given the small sample.
Two clear tiers emerge: Beach Crescent and Marinaside Crescent are the premium waterfront corridor, trading at $1,387–$1,397 per square foot with strata fees to match ($1,092–$1,642/month). Homer, Richards, Smithe, and Beatty form the more accessible core-Yaletown tier, generally $860–$1,120 per square foot with meaningfully lower carrying costs.
(For a deeper look at Marinaside Crescent specifically — including its condo towers — see our Marinaside Crescent Deep Research Brief.)
8-Year Market Data (2019–2026)
| Year | Sales | Median Sold Price | Median $/sqft | Median DOM | Median SP/LP | Avg Strata Fee |
|---|---|---|---|---|---|---|
| 2019 | 18 | $1,521,500 | $1,126 | 38 | 95% | $827 |
| 2020 | 20 | $1,285,500 | $1,071 | 18 | 97% | $763 |
| 2021 | 41 | $1,700,000 | $1,174 | 18 | 97% | $990 |
| 2022 | 29 | $1,550,000 | $1,201 | 27 | 97% | $991 |
| 2023 | 19 | $1,825,500 | $1,321 | 24 | 96% | $984 |
| 2024 | 17 | $1,545,000 | $1,225 | 20 | 98% | $1,143 |
| 2025 | 14 | $1,451,250 | $1,085 | 46 | 96% | $1,064 |
| 2026 (through Aug 13) | 12 | $1,440,000 | $1,003 | 31 | 96% | $1,196 |
2026 figures are partial-year (8.5 months) and will shift as more sales close.
Key price and value storylines
Yaletown townhouses peaked on both price and price-per-square-foot in 2023 — not 2021 or 2022, which is when most of the broader downtown condo market topped out. That’s worth sitting with: 2023’s low volume (19 sales) combined with high prices suggests a market where a handful of exceptional, larger homes closed that year and pulled the median up, rather than broad-based appreciation.
From that 2023 peak, both metrics have come down meaningfully: median price is off 21%, and price per square foot is off 24%. Measured from 2019 instead, the picture is much milder — median price is down only about 5%, and $/sqft down about 11%. In other words: owners who bought before the 2021–2023 run-up are still roughly whole or ahead. Buyers who purchased at the 2023 peak are likely underwater in nominal terms today.
Volume tells its own story. 2021 was the busiest year on record for Yaletown townhouse sales — 41 closings, more than double a typical year — almost certainly pandemic-era demand for more space and private outdoor areas. Since then, volume has fallen every year except a small 2022 bump, down to just 12 sales through mid-August 2026. Fewer sellers are listing, and fewer transactions are closing — consistent with a market where existing owners who don’t need to move are choosing to sit tight through the current fee and price pressure rather than sell into it.
Days on Market & Sold-to-List Ratio
Speed of sale swung hard with the cycle: 2020–2021 townhouses sold in about 18 days on average — a genuine seller’s market. That stretched to 27 days by 2022, held near 20–24 days through 2023–2024, then jumped to 46 days in 2025, the slowest year on record, before easing back to 31 days through the first two-thirds of 2026.
What didn’t move nearly as much is the sold-to-list ratio — the percentage of asking price sellers actually received. Every single year from 2019 through 2026, it stayed in a tight 95–98% band (overall median: 97%). That’s a notably narrow range for an eight-year window that included a pandemic boom and a rate-driven correction. It suggests Yaletown townhouse sellers who price realistically are still getting close to their number — the softness shows up in how long it takes, not in how much below ask homes ultimately sell for.
Average monthly strata fees are up 45% since 2019 — a real, growing carrying cost.
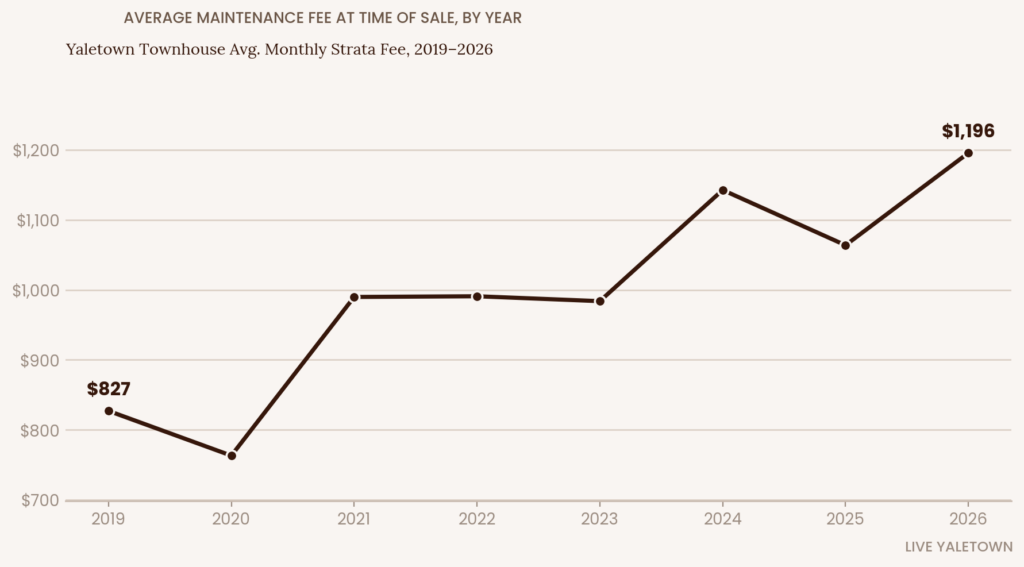
Average monthly strata fee for Yaletown townhouses, 2019–2026 — up 45% in seven years.
Strata Fee Trend — Worth Budgeting For
| Year | Avg Monthly Strata Fee |
|---|---|
| 2019 | $827 |
| 2020 | $763 |
| 2021 | $990 |
| 2022 | $991 |
| 2023 | $984 |
| 2024 | $1,143 |
| 2025 | $1,064 |
| 2026 | $1,196 |
Average monthly fees are up 45% since 2019 — a real, ongoing cost increase that isn’t reflected in the purchase price headline. It’s worth noting this is a gentler climb than what’s been happening in Yaletown’s highrise condo towers over the same period, likely because most townhouses carry fewer shared mechanical systems — no elevators to maintain, often smaller shared amenity footprints — than a 20-to-30-year-old highrise. That said, a $1,300,000 townhouse purchase carrying close to $1,200/month in fees is a materially different monthly budget than the same price tag implied five years ago, and it belongs in every buyer’s affordability math and every seller’s pricing conversation.
Price Ranges by Bedroom Count (2024–2026)
| Bedrooms | Sales | Low | Median | High | Median $/sqft |
|---|---|---|---|---|---|
| 1 BR | 3 | $950,000 | $975,000 | $1,060,000 | $1,011 |
| 2 BR | 26 | $790,000 | $1,440,000 | $3,350,000 | $1,114 |
| 3 BR | 14 | $1,400,000 | $2,309,844 | $5,250,000 | $1,247 |
Two-bedroom townhouses are the volume driver of this market — 26 of the 43 recent sales — with the bulk of activity between roughly $950,000 and $1,600,000; the $3.35M high end reflects an exceptional large unit, not typical 2BR product. Three-bedroom homes span the widest range by far, from entry-level three-bedrooms at $1.4M up to $5.25M+ estate-style properties — building, street, and finish level matter enormously at this end.
Notable Complexes (3+ sales, 2019–2026)
| Complex | Sales | Median Sold | Median $/sqft | Median Strata Fee |
|---|---|---|---|---|
| Quaywest | 8 | $2,115,000 | $1,339 | $1,041 |
| H&H | 8 | $1,245,000 | $1,022 | $635 |
| Crestmark II | 6 | $2,187,500 | $1,350 | $1,280 |
| Pomaria | 6 | $1,444,000 | $1,122 | $977 |
| 888 Beach | 5 | $1,545,000 | $1,096 | $1,197 |
| Marinaside Resort | 5 | $1,005,000 | $1,342 | $479 |
| City Crest | 4 | $1,470,000 | $1,228 | $588 |
| Crestmark I | 4 | $2,112,500 | $1,466 | $1,093 |
| The Grace | 3 | $1,935,000 | $1,219 | $1,122 |
| Columbus | 3 | $1,888,800 | $1,315 | $848 |
| Yaletown Park 1 | 3 | $1,625,000 | $971 | $1,013 |
| The Max | 3 | $1,310,000 | $1,193 | $855 |
| Park Plaza | 3 | $1,403,921 | $1,013 | $694 |
| Richards Living | 3 | $1,240,000 | $1,103 | $472 |
| The Savoy | 3 | $825,000 | $1,006 | $466 |
Top Sales on Record (2019–2026)
- 268 Beach Crescent (The Ericson) — $6,988,800 · June 2022 · 3 bed · 3,369 sqft
- 1576 Homer Mews — $6,400,000 · November 2021 · 3 bed · 2,476 sqft
- 105–1515 Homer Mews (King’s Landing) — $5,850,000 · August 2020 · 3 bed · 2,380 sqft
- 1576 Homer Mews — $5,250,000 · August 2026 · 3 bed · 2,476 sqft
- 403 Beach Crescent (Waterford) — $4,900,000 · April 2022 · 4 bed · 2,759 sqft
- TH103–633 Kinghorne Mews (Icon II) — $4,750,000 · July 2021 · 3 bed · 2,431 sqft
- 1258 Richards Street (The Grace) — $4,020,000 · January 2019 · 2 bed · 2,747 sqft
- D2–988 Beach Avenue (1000 Beach Villas) — $3,600,000 · March 2020 · 3 bed · 3,362 sqft
- 505 Beach Crescent (Azura II) — $3,589,000 · September 2023 · 3 bed · 2,608 sqft
- 505 Beach Crescent — $3,562,000 · July 2021 · 3 bed · 2,625 sqft
Worth flagging: #2 and #4 are the same home — 1576 Homer Mews sold for $6,400,000 in November 2021, then resold for $5,250,000 in August 2026. That’s an 18% decline over five years on one of the neighbourhood’s most expensive townhouses, and it’s a real-world illustration of the peak-to-today softness this data shows across the market, concentrated at the very top of the price range.
Current Active Inventory (11 listings)
| Address | Complex | Beds | List Price | List $/sqft | Days on Market |
|---|---|---|---|---|---|
| 104–1168 Richards Street | Park Lofts | 1 | $1,022,000 | $945 | 45 |
| 1053 Homer Street | Domus | 2 | $1,088,000 | $995 | 166 |
| 2P–1033 Marinaside Crescent | Quaywest | 2 | $1,188,000 | $1,375 | 45 |
| 428 Helmcken Street | H&H | 1 | $1,188,000 | $1,017 | 96 |
| 201–289 Drake Street | Parkview | 2 | $1,299,000 | $959 | 117 |
| 918 Homer Street | Yaletown Park 1 | 2 | $1,565,000 | $1,282 | 8 |
| 973 Mainland Street | Yaletown Park 3 | 3 | $1,799,000 | $1,136 | 12 |
| TH105–638 Beach Crescent | — | 3 | $1,999,000 | $1,286 | 115 |
| 1260 Richards Street | The Grace | 2 | $2,289,900 | $1,342 | 94 |
| 410 Beach Crescent | King’s Landing | 2 | $2,698,000 | $1,705 | 58 |
| 595 Beach Crescent | Two Parkwest | 3 | $3,188,000 | $1,406 | 120 |
(See the full list of active Yaletown townhouse listings for current availability.)
The median active listing has been on market 94 days — well above the market’s 27-day historical median — and is priced at roughly $1,282/sqft, about 21% above the $1,056/sqft median of what’s actually sold in the trailing 12 months. Two listings stand out as exceptions, moving at 8 and 12 days on market — a reminder that even in a slower market, the right listing at the right moment still sells fast; the data here doesn’t tell us why (condition, presentation, and specific unit appeal all factor in beyond what a sold sheet captures).
Who Buys a Yaletown Townhouse?
This is a distinct buyer from the typical Yaletown condo purchaser:
The space-seeking family or couple. Ground-oriented living, multiple floors, and — in many complexes — a private patio or rooftop deck, without leaving the walkability of Yaletown. Often people who’d consider a house but don’t want the commute or yard maintenance that comes with it.
The downsizer who still wants room. Empty-nesters leaving a larger Westside or suburban house who want square footage and separation of space (a den, a second level) rather than a single-floor condo plan.
The work-from-home professional. An extra floor or room that functions as a real home office is a recurring feature of what sells well in this data — multi-level layouts solve a problem open-plan condos don’t.
The pet owner. Several complexes (particularly the Homer and Richards Street corridor) have ground-level or near-ground access that makes daily dog walks dramatically easier than a 30th-floor condo — a real, recurring reason buyers cite this housing type specifically.
For Buyers: What This Data Actually Means Right Now
You have more leverage than the list prices suggest. With active listings sitting a median 94 days and priced roughly 21% above recent closed comps, there’s real room to negotiate on anything that isn’t already priced tight to the market — and the two fast-moving current listings (8 and 12 days) show you exactly what “priced right” looks like.
Don’t anchor to 2021–2023 comps. If an agent or a listing description is referencing peak pricing from that window, ask for the trailing-12-month comps instead — that’s the number that reflects what buyers are actually paying today.
Underwrite the strata fee, not just the price. A $1,300,000 townhouse with $1,200/month in fees carries meaningfully differently than the same price with $700/month in fees — factor the specific building’s fee trajectory into your offer, not just the purchase price.
Match your budget to the right corridor. Homer, Richards, Smithe, and Beatty offer the most accessible entry points ($860–$1,160/sqft); Marinaside Crescent and Beach Crescent carry a genuine premium for waterfront position that’s held up even through the broader softening.
For Sellers: What This Data Actually Means Right Now
Price to trailing comps, not to 2023. The market has come down 21% in price and 24% in $/sqft from its peak — a listing priced off outdated comps is the single most common reason homes are sitting 90+ days right now.
Days on market is the real signal, not sold-to-list ratio. Because SP/LP has stayed remarkably stable (95–98%) across the whole cycle, a stale listing doesn’t show up as “selling for way under ask” — it shows up as sitting unsold for months. If your home has been active more than 60 days, that’s the data telling you the price is the issue, not buyer demand generally.
Your strata fee history is now a disclosure buyers are actively pricing in. With fees up 45% since 2019, be ready to walk buyers through what that money has funded (or is being reserved for) — it’s a credibility builder, not a liability, when handled transparently.
Volume is down, but so is competing supply. Only 12 townhouses have sold in Yaletown through mid-2026 — that scarcity cuts both ways. A well-priced, well-presented listing faces less direct competition than it would in a higher-volume year like 2021.
Frequently Asked Questions
How much do townhouses cost in Yaletown? Recent sales (2024–2026) range from roughly $790,000 for a two-bedroom up to $5.25M+ for large three-bedroom waterfront homes. The overall median sold price in 2026 is $1,440,000.
Are Yaletown townhouse prices going up or down in 2026? Down from their 2023 peak — median price is off 21% and price per square foot is off 24% from that high — but only modestly below where they stood back in 2019 (-5% and -11% respectively).
How long does it take to sell a townhouse in Yaletown? The historical median is 27 days on market, but that’s climbed as high as 46 days (2025) and currently sits around 31 days for 2026 sales. Active listings right now have a median of 94 days — a signal that current asking prices are running ahead of the market.
What streets have the most Yaletown townhouses? Marinaside Crescent (42 sales since 2019), Homer Street (27), Richards Street (20), and Howe Street (12) account for the bulk of transaction volume.
How much are strata fees for a Yaletown townhouse? The average has climbed from $827/month in 2019 to $1,196/month in 2026 — a 45% increase. Fees vary significantly by complex, from under $500/month at Richards Living and The Savoy to over $1,600/month on Beach Crescent.
Is now a good time to buy or sell a Yaletown townhouse? For buyers: current active listings are priced well above recent sold comps and sitting far longer than historical norms, which favours patient, comp-driven offers. For sellers: pricing to trailing 12-month sold data — not 2023 peak pricing — is the difference between a 2-week sale and a 90+ day listing.
Thinking about buying or selling a Yaletown townhouse?
Yuliya Lys is a REALTOR® and PREC with The Partners Real Estate, specializing in Yaletown — including its townhouse market — since 2016. She works directly from sold-data and building-specific history like what’s above, so buyers and sellers get a realistic picture before any decision is made.
Call or text: 604-500-5838 Email: yuliya@yuliyalys.com
Source: MLS® data compiled through Greater Vancouver REALTORS®, 170 closed sales and 11 active listings, Yaletown townhouse sub-area (VVWYA), January 2, 2019 – August 13, 2026.