The Yaletown real estate market ended September 2026 with 23 sales, the fewest since January, while 76 genuinely new listings came to market, the most since April. As a result, buyers head into October with about eight months of supply to choose from and real room to negotiate.
That said, prices have held up better than volume. In fact, condos that were priced right from day one still sold within about 3% of asking. The sellers losing ground are the ones who started high, pulled their listing and tried again.
Data: MLS® records for the Yaletown sub-area (Vancouver West), 440 sales from September 1, 2025 to September 30, 2026, plus 593 withdrawn listings and 238 active listings as of October 13, 2026. Condos and townhouses only; parking stalls, storage lockers and moorage are excluded.
From the ground in September: Buyers are still out there, but they’re splitting into two groups. Some are holding out for exactly the right home and won’t compromise on layout, view or building. Others are choosing to buy now, before their pre-approved mortgage rate holds expire and they have to requalify at a higher rate. — Yuliya Lys
Key Takeaways
- Sales fell by half year over year. Yaletown recorded 23 sales in September 2026, compared with 48 in September 2025.
- New supply rose. 76 fresh listings came to market in September, up from 42 in August.
- Inventory is deep. 238 homes were active as of October 13, roughly eight months of supply at the current sales pace.
- Condo prices are softer, not collapsing. The September median was $1,037 per square foot, down about 5% from $1,090 a year earlier. The median sale price fell further, but only because no three-bedrooms sold this September.
- Same floorplans are selling for slightly less. When the same stack resold this year, the recent sale came in a median 2.6% lower per sq. ft. Desirable stacks, such as the Aquarius 07 marina-view one-bedrooms, held their value.
- Days on market are stretching. The median condo that sold in September took 73 days, including any earlier listing period, compared with 48 days a year ago.
- Overpricing is expensive. Units that sold without being withdrawn went for a median 2.9% under asking in 31 days. In contrast, units that were withdrawn and relaunched sold 9.1% below their original price after 112 days.
- Withdrawals tracked sales. Sellers are not pulling listings any more than last year relative to sales, at about 1.4 withdrawals per sale.
Yaletown Market Snapshot: September 2026
Yaletown sales fell much harder than the region in September, while fresh listings held level with a year earlier.
| Yaletown (condos + townhouses) | Sep 2025 | Sep 2026 | Change |
|---|---|---|---|
| Sales | 48 | 23 | −52% |
| Fresh listings (first time on market) | 72 | 76 | +6% |
| Relaunched listings | 41 | 27 | −34% |
| Withdrawn listings | 72 | 33 | −54% |
| Withdrawals per sale | 1.50 | 1.43 | Flat |
| Condo median sold price (affected by which units sold) | $835,000 | $730,000 | −13% |
| Condo median $/sq. ft. | $1,090 | $1,037 | −5% |
| Condo sale-to-list ratio | 97.8% | 96.3% | −1.5 pts |
| Condo median days on market (incl. relists) | 48 | 73 | +25 days |
The 13% drop in median price overstates the decline. September 2025 included seven three-bedroom sales, five of them over $2 million, whereas September 2026 had none. Like for like, the median one-bedroom fell from $667,500 to $622,500 (−7%), and $/sq. ft. across all condos fell about 5%. In addition, 17 of the 23 September sales were still pending when the data was pulled, so the final count may tick up slightly.
For context, Greater Vancouver Realtors reported 1,717 regional sales in September, down 8.4% year over year. The apartment benchmark price was $761,800 in Vancouver West, down 5.2% year over year and 1.7% from August. Yaletown’s 5% drop in condo $/sq. ft. lines up with that, but its sales decline was far steeper than the region’s.
Yaletown Month by Month: September 2025 to September 2026
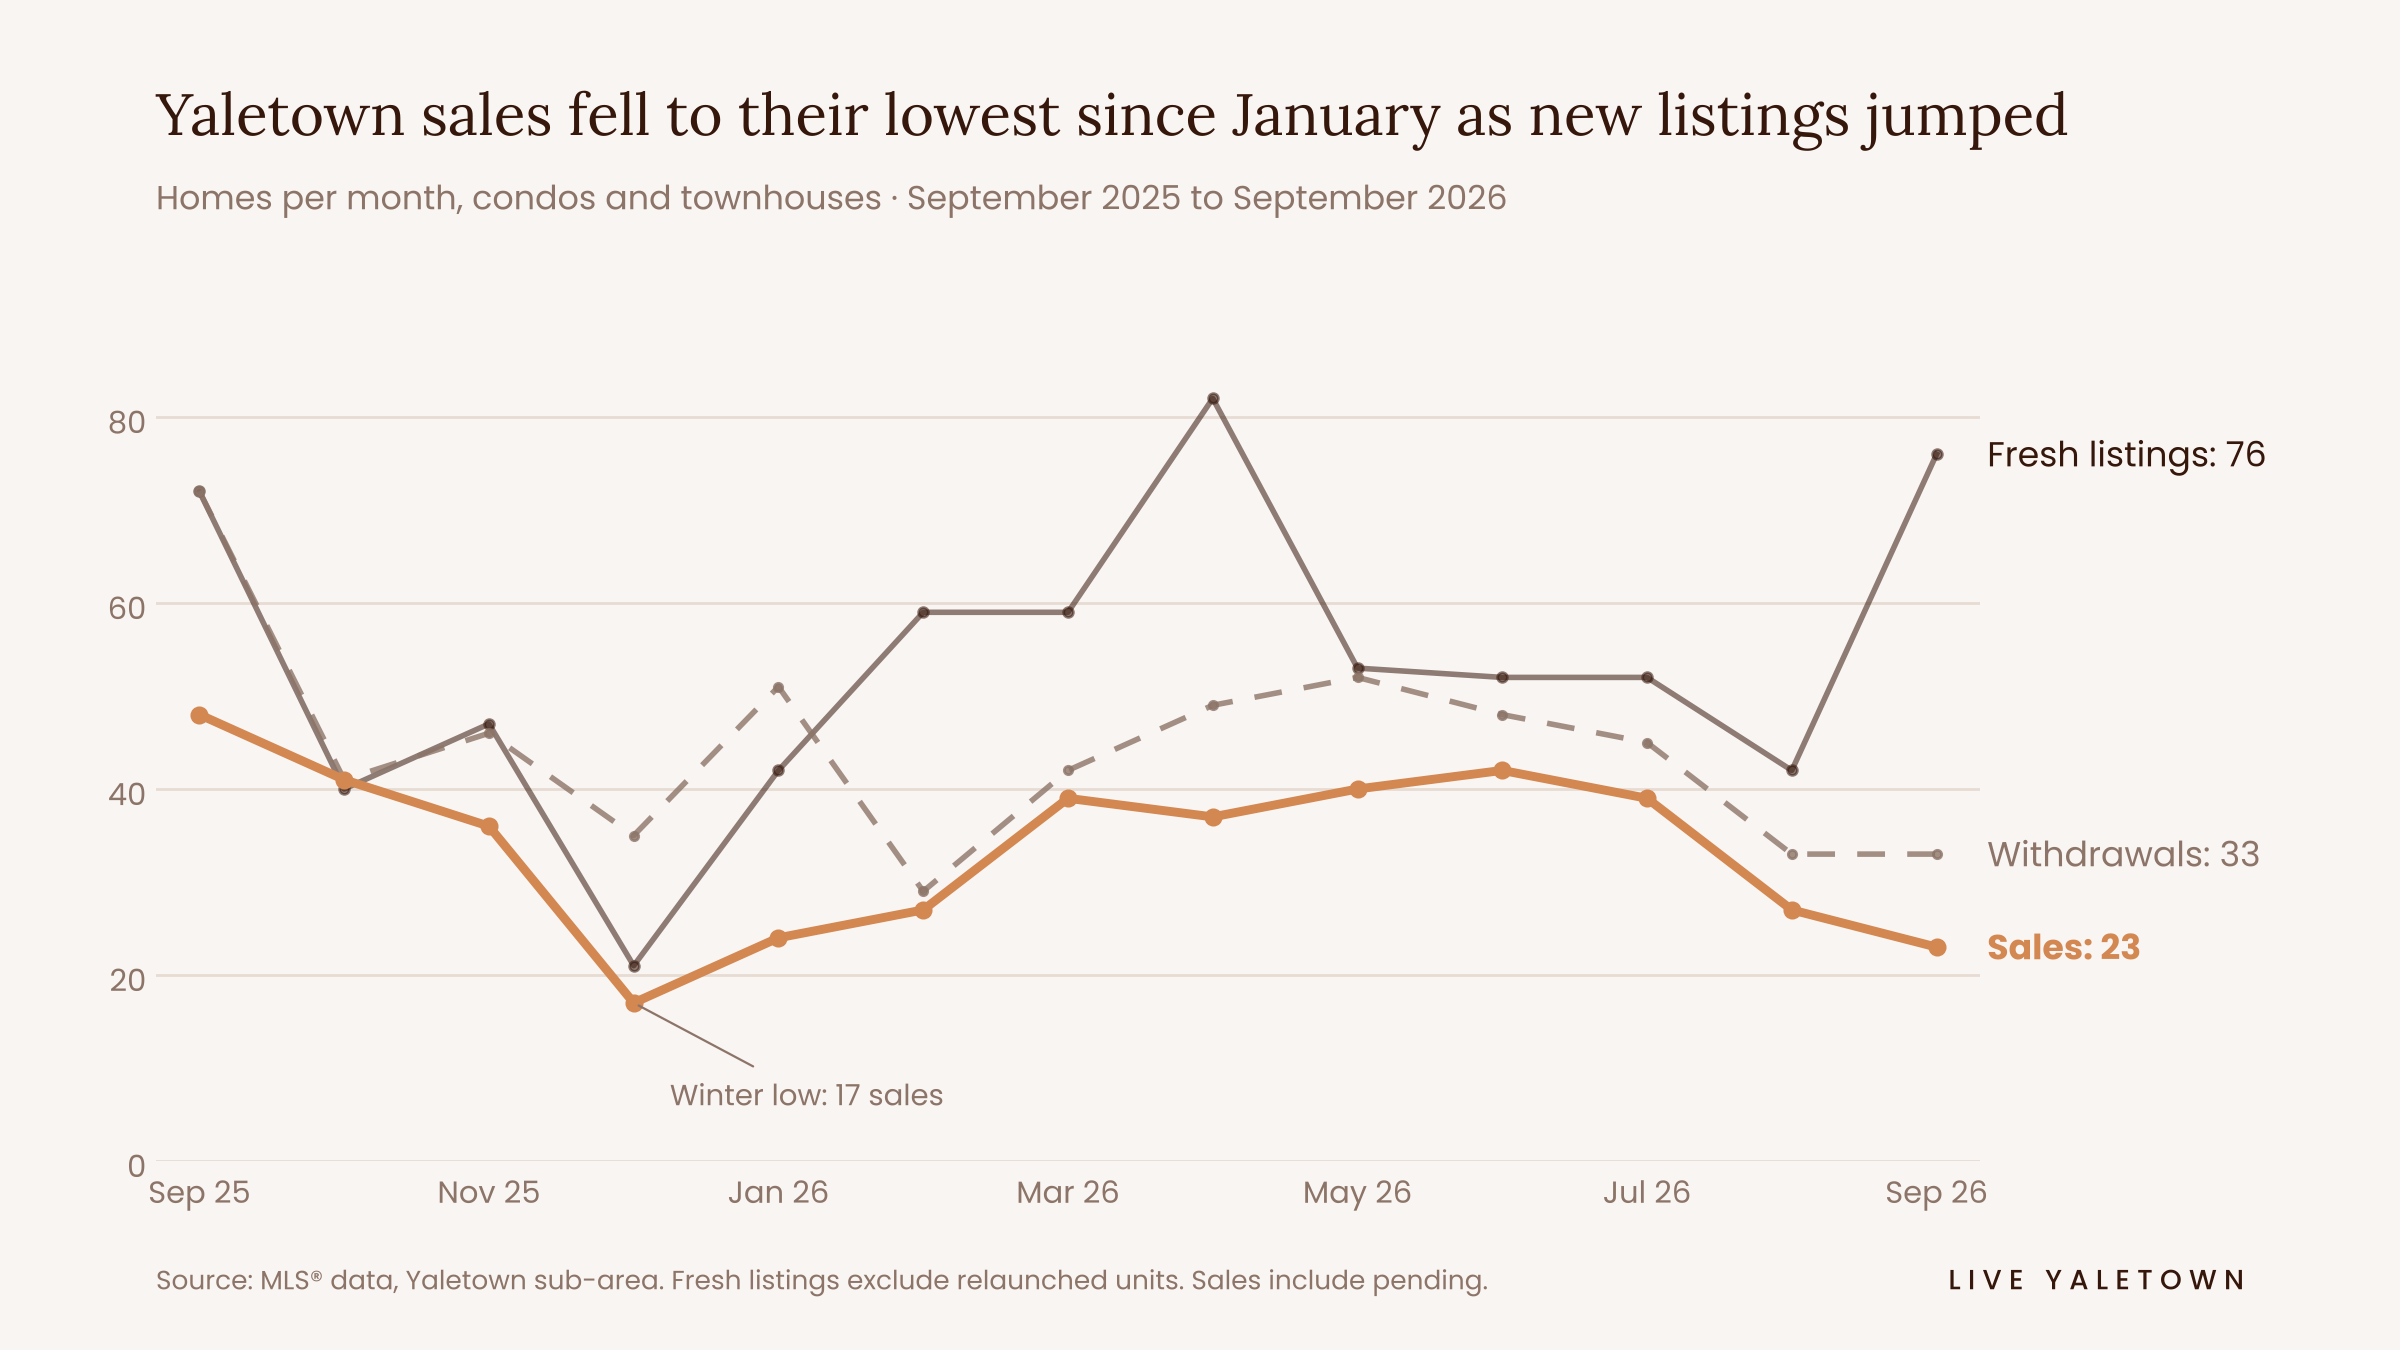
The year moved in four phases. First, a busy fall faded into a winter low of 17 sales in December. Next, sales held at 37–42 a month from March through July, the strongest stretch of the year. Since then, sales have slipped for two straight months, while September’s fresh listings jumped back to 76.
Yaletown Condo Prices by Bedroom
One-bedrooms are the tightest segment, while two-bedroom sellers are asking well above what recent buyers paid.
| Condos | Sold Jul–Sep | Median sold | Sold $/sq. ft. | Active now | Median asking | Asking $/sq. ft. | Months of supply |
|---|---|---|---|---|---|---|---|
| 1 bedroom | 31 | $610,000 | $1,037 | 69 | $699,000 | $1,057 | 6.7 |
| 2 bedroom | 46 | $1,155,000 | $1,087 | 128 | $1,199,300 | $1,136 | 8.3 |
| 3 bedroom+ | 7 | $2,175,000 | $1,455 | 23 | $2,180,000 | $1,339 | 9.9 |
Two-bedroom listings are asking about 4.5% more per square foot than Q3 buyers paid. With more than eight months of supply, that gap is likely to close through price cuts rather than buyers paying up.
The three-bedroom figures rest on only seven sales, so treat them as directional. Over the full 12 months, 30 three-bedroom condos sold at a median $1,309 per sq. ft., which is closer to today’s asking prices.
By price range
| Price range (condos + townhouses) | Sold Jul–Sep 2026 | Active now | Months of supply |
|---|---|---|---|
| Under $600,000 | 15 | 28 | 5.6 |
| $600,000–$800,000 | 15 | 47 | 9.4 |
| $800,000–$1M | 16 | 37 | 6.9 |
| $1M–$1.5M | 26 | 73 | 8.4 |
| $1.5M–$2M | 8 | 28 | 10.5 |
| Over $2M | 9 | 25 | 8.3 |
Entry-level condos under $600,000 are the most balanced part of the market. Meanwhile, the $600,000–$800,000 band and the $1.5M–$2M band carry the deepest inventory relative to sales. For a closer look at the larger units, see Compact 3-Bedroom vs. Large 2-Bedroom.
Withdrawn and Relisted: What Overpricing Costs Yaletown Sellers
A Yaletown condo that has to be withdrawn and relaunched sells for about 6% less than one priced right the first time, and takes nearly four times as long.
| Sales, Sep 2025–Sep 2026 | Units | Median sold vs. original asking | Median days on market |
|---|---|---|---|
| Sold on the first listing | 303 | −2.9% | 31 |
| Withdrawn, relaunched, then sold | 132 | −9.1% | 112 |
Withdrawals are common in Yaletown, but most of them are not sellers giving up. Of the 593 listings withdrawn over the past 13 months, 414 returned to the market, and 321 of those came back within a week. In most cases, the listing was cancelled and relaunched with a fresh start on days on market, often alongside a price cut. About one relaunch in five came back at essentially the same price.
Overall, 395 individual units were withdrawn at least once:
- 132 were relaunched and sold
- 83 were relaunched and are still for sale
- 180 have not returned to the market
- 120 were withdrawn two or more times, and one unit was withdrawn eight times
Relaunched units that went on to sell came back a median 3.9% below their previous asking price. Similarly, relaunched units still on the market are asking a median 5.3% less than before. In short, a relaunch on its own changes little; what matters is whether the new price meets the market.
Is this getting worse? Not relative to sales. Withdrawals per sale ran between 1.0 and 1.5 for most of the year and peaked at about 2.1 in December and January, the usual holiday pull-back. In September 2026, the ratio was 1.43, compared with 1.50 a year earlier.
Most Active Yaletown Buildings and Top Sales
The Arc at 89 Nelson Street was Yaletown’s busiest building over the past year, with 17 condo sales at a median $1,273 per sq. ft.
| Building | Address | Sales (12 mo.) | Median sold | Median $/sq. ft. | Year built | Strata fee $/sq. ft./mo. |
|---|---|---|---|---|---|---|
| The Arc | 89 Nelson Street | 17 | $648,000 | $1,273 | 2019 | $0.72 |
| Richards Living | 1088 Richards Street | 13 | $620,000 | $1,057 | 2011 | $0.52 |
| Vancouver House | 1480 Howe Street | 13 | $875,000 | $1,138 | 2020 | $1.22 |
| Yaletown Park 2 | 909 Mainland Street | 12 | $610,194 | $1,010 | 2006 | $0.78 |
| The Max | 928 Beatty Street | 12 | $655,000 | $1,028 | 2005 | $0.81 |
| Pacific Point II | 1323 Homer Street | 10 | $868,500 | $940 | 1993 | $0.62 |
| Quaywest | 1033 Marinaside Crescent | 9 | $1,135,000 | $1,124 | 2001 | $0.85 |
| Aquarius | 1199 Marinaside Crescent | 9 | $922,500 | $1,163 | 1999 | $0.82 |
| The Discovery | 1500 Howe Street | 9 | $633,500 | $839 | 1989 | $0.73 |
| Landmark 33 | 1009 Expo Boulevard | 9 | $610,000 | $874 | 1997 | $0.86 |
Age still drives value in Yaletown. Buildings completed since 2019 traded above $1,100 per sq. ft., while the 1989–1997 towers sold between $839 and $940. With 9 to 17 sales each, these medians are useful guides rather than precise valuations. For building-by-building detail on the waterfront, see our Marinaside Crescent Deep Research Brief.
Top Yaletown sales, Sep 2025–Sep 2026
| Sold | Building | Type | Size | Sold price | $/sq. ft. |
|---|---|---|---|---|---|
| Oct 2025 | King’s Landing | 3-bed condo | 2,673 sq. ft. | $5,888,000 | $2,203 |
| Sep 2026 | The Erickson, Homer Mews | 3-bed townhouse | 3,057 sq. ft. | $5,800,000 | $1,897 |
| Aug 2026 | Homer Mews | 3-bed townhouse | 2,476 sq. ft. | $5,250,000 | $2,120 |
| Aug 2026 | Vancouver House | 3-bed condo | 3,017 sq. ft. | $5,200,000 | $1,724 |
| Aug 2026 | King’s Landing | 3-bed condo | 2,192 sq. ft. | $4,888,000 | $2,230 |
The luxury end stayed active through the summer, with four of the top five sales closing in August and September 2026. For more on Yaletown’s townhomes, see our Yaletown Townhouses Deep Research Brief.
Same Floorplan, Different Market: Yaletown Resales Compared
When the same floorplan in the same Yaletown building sold twice this year, the more recent sale came in a median 2.6% lower per sq. ft., comparing units within five floors of each other.
To measure this, we matched condos in the same building and stack, within 3% of the same size, that sold once between September 2025 and March 2026 and again between April and September 2026. That produced 58 pairs across 41 stacks. Across all 58 pairs, including those many floors apart, the median change was −0.6%. Among the 28 pairs within five floors, the median was −2.6%, and 18 sold for less. We also read each listing to check whether one unit had been renovated and the other had not.
| Building and stack | Earlier sale | Recent sale | Change $/sq. ft. | Condition notes |
|---|---|---|---|---|
| Aquarius, 1199 Marinaside Crescent 07 stack, 1 bed + den |
#1907 · Oct 2025 725 sq. ft. · $850,000 $1,172/sq. ft. |
#1707 · Jun 2026 731 sq. ft. · $856,000 $1,171/sq. ft. |
−0.1% | #1707 updated (bath, kitchen cabinets, flooring, paint); no updates noted for #1907 |
| Aquarius, 1199 Marinaside Crescent 05 stack, 1 bed + den |
#2305 · Jan 2026 800 sq. ft. · $914,000 $1,143/sq. ft. |
#3605 · Jun 2026 800 sq. ft. · $930,000 $1,163/sq. ft. |
+1.8% | #3605 top floor, 9-ft ceilings, updated kitchen and bath; #2305 well kept, not updated |
| The Arc, 89 Nelson Street 04 stack, 1 bed |
#1804 · Nov 2025 501 sq. ft. · $638,000 $1,273/sq. ft. |
#2004 · Jun 2026 500 sq. ft. · $635,000 $1,270/sq. ft. |
−0.3% | Comparable finishes; #2004 sold with a tenant in place |
| Richards Living, 1088 Richards Street 07 stack, 1 bed + den |
#507 · Nov 2025 589 sq. ft. · $610,000 $1,036/sq. ft. |
#407 · Jul 2026 585 sq. ft. · $612,000 $1,046/sq. ft. |
+1.0% | #507 sold with a tenant in place; #407 move-in ready with minor upgrades |
| West One, 1408 Strathmore Mews 07 stack, 2 bed |
#3107 · Sep 2025 1,139 sq. ft. · $1,536,000 $1,349/sq. ft. |
#3007 · Sep 2026 1,139 sq. ft. · $1,500,000 $1,317/sq. ft. |
−2.3% | #3007 had new hardwood and appliances, yet sold for less |
| The Discovery, 1500 Howe Street 01 stack, 1 bed |
#1701 · Oct 2025 728 sq. ft. · $605,000 $831/sq. ft. |
#1401 · Jul 2026 747 sq. ft. · $600,000 $803/sq. ft. |
−3.3% | #1701 had newer windows, flooring and appliances |
| Vancouver House, 1480 Howe Street 01 stack, 1 bed + den |
#4201 · Mar 2026 859 sq. ft. · $925,000 $1,077/sq. ft. |
#3901 · Aug 2026 847 sq. ft. · $875,000 $1,033/sq. ft. |
−4.1% | Comparable; #4201 sold with a tenant in place |
| Park West One, 455 Beach Crescent 02 stack, 2 bed |
#1902 · Nov 2025 1,147 sq. ft. · $1,315,000 $1,146/sq. ft. |
#1802 · Jul 2026 1,146 sq. ft. · $1,250,000 $1,091/sq. ft. |
−4.9% | #1902 had an upgraded kitchen, A/C and built-in closets |
| Nova, 989 Beatty Street 05 stack, 1 bed |
#1105 · Oct 2025 577 sq. ft. · $575,000 $997/sq. ft. |
#1205 · Jun 2026 576 sq. ft. · $535,000 $929/sq. ft. |
−6.8% | Comparable condition, one floor apart |
| Domus, 1055 Homer Street 01 stack, 1 bed + den |
#501 · Nov 2025 771 sq. ft. · $765,000 $992/sq. ft. |
#401 · Sep 2026 790 sq. ft. · $730,000 $924/sq. ft. |
−6.9% | #401 extensively updated in 2026, yet sold for less |
| The Waterford, 1483 Homer Street 06 stack, 2 bed + den |
#506 · Oct 2025 1,075 sq. ft. · $1,119,000 $1,041/sq. ft. |
#706 · Apr 2026 1,075 sq. ft. · $1,230,000 $1,144/sq. ft. |
+9.9% | #706 listed with water and city views; #506 listed city views |
| The Peninsula, 1201 Marinaside Crescent 01 stack, 2 bed + den |
#2001 · Sep 2025 979 sq. ft. · $1,140,000 $1,164/sq. ft. |
#1901 · Sep 2026 976 sq. ft. · $960,800 $984/sq. ft. |
−15.5% | #2001 fully remodelled in 2021; #1901 not updated and sold with a tenant in place |
Aquarius #1907 and #1707 show what the right stack can do. #1907 sold in October 2025. Eight months later, while comparable Yaletown resales were slipping, #1707 sold two floors lower for $6,000 more, at the same price per sq. ft. Southwest-facing, marina-view floorplans in established waterfront buildings remain in demand. That said, #1707 had been updated, so its condition helped it hold that level.
In contrast, several units sold for less even after a renovation. Domus #401 and West One #3007 were both updated, yet sold below their earlier, unrenovated counterparts. Likewise, Aquarius #3605 added a top-floor position, higher ceilings and upgrades, yet sold only 1.8% above #2305. Taken together, these suggest like-for-like values have softened by roughly 3–7% over the year.
Finally, the biggest swings came from differences in the units themselves, not the market. The Waterford gain reflects a water view, and The Peninsula drop reflects a 2021 renovation against an un-updated, tenanted unit.
Into October: What’s for Sale in Yaletown Now
As of October 13, 2026, 238 homes were for sale in Yaletown: 228 condos and 10 townhouses. Nearly half of them have been on the market for more than 90 days.
- Time on market: the median active listing has been on the market 85 days, counting any earlier listing period. 113 listings have passed 90 days.
- Relaunches: 69 active listings (29%) are relaunches of units that were previously withdrawn.
- Price cuts: at least 47 active listings have already reduced their price.
- October so far (Oct 1–13): 25 new listings came on, 14 of them fresh and 11 relaunches. Meanwhile, 17 listings were withdrawn, and 10 of those have already been relaunched.
October sales are not yet included in this data and will be covered in next month’s report. However, the pattern points the same way: steady new supply, slower sales and more negotiating room for buyers through the fall.
For background on the wider downtown slowdown, read Why Are Yaletown, Coal Harbour & Downtown Condos Dropping?
What This Means for Yaletown Buyers
This fall is the strongest negotiating position Yaletown buyers have had this year, particularly on two-bedrooms and anything above $1.5 million.
- Check the history, not just the asking price. About 3 in 10 active listings are relaunches. A listing that shows 10 days on market may have been for sale for months.
- Use the data in negotiation. Units that were withdrawn and relaunched sold a median 9.1% below their original price. So, a long-listed unit is a reasonable place to open well below asking.
- Don’t expect deep discounts on well-priced one-bedrooms. Entry-level condos under $600,000 have about 5.6 months of supply, the tightest segment in Yaletown.
- Weigh the building, not just the unit. Strata fees ranged from $0.52 to $1.22 per sq. ft. a month among the busiest buildings, which on a 1,000 sq. ft. home is a difference of about $700 a month.
What This Means for Yaletown Sellers
Pricing correctly at launch is the single biggest factor in how a Yaletown sale turns out right now.
- The first price matters most. Sellers who priced right sold a median 2.9% under asking in 31 days, whereas those who relaunched gave up 9.1% and waited 112 days.
- Price to sold data, not to other listings. Two-bedroom sellers are asking about 4.5% more per sq. ft. than buyers paid in Q3. Listings priced off the competition are pricing off an asking level that isn’t selling.
- Expect competition from fresh inventory. September brought 76 new listings, and new supply is continuing in October.
- A relaunch needs a real change. Relaunches at the same price went on to sell 42% of the time, compared with 47% for relaunches that came with a price cut. Resetting days on market alone does little.
Yaletown Real Estate FAQ
Is the Yaletown real estate market up or down in 2026?
It is down. In September 2026, the median Yaletown condo sold for $1,037 per sq. ft., about 5% lower than September 2025. Sales fell from 48 to 23 over the same period.
How much does a condo cost in Yaletown?
From July to September 2026, the median one-bedroom sold for $610,000 and the median two-bedroom for $1,155,000. Three-bedroom condos sold for a median of about $2.2 million.
Is Yaletown a buyer’s or seller’s market right now?
It is a buyer’s market. With 238 homes for sale and about 30 sales a month, Yaletown has roughly eight months of supply, which favours buyers.
How long does it take to sell a condo in Yaletown?
A well-priced Yaletown condo sold in a median 31 days over the past year. In contrast, units that were withdrawn and relaunched took a median 112 days.
How much below asking are Yaletown condos selling?
In September 2026, condos sold for a median 96.3% of their final asking price. However, units that were relaunched sold a median 9.1% below their original asking price.
Which Yaletown buildings sell the most?
Over the past 12 months, the most active buildings were The Arc (17 sales), Richards Living and Vancouver House (13 each), and Yaletown Park 2 and The Max (12 each).
Are the same Yaletown condos selling for less than last year?
Slightly. When the same floorplan in the same building resold in 2026, it sold for a median 2.6% less per sq. ft., comparing units within five floors. For example, Nova #1105 at 989 Beatty Street sold for $575,000 in October 2025, and #1205 in the same stack sold for $535,000 in June 2026. Desirable stacks held up better: Aquarius #1707 at 1199 Marinaside Crescent sold for $856,000 in June 2026, $6,000 more than #1907 in October 2025.
Talk to a Yaletown Specialist
I’m Yuliya Lys, Partner, PREC at The Partners Real Estate. I’ve specialized in Yaletown since 2016 and rank in the top 10% of Greater Vancouver Realtors. If you’re buying or selling in Yaletown, I can show you exactly where your building or unit sits in this data.
Call or text 604-500-5838 · yuliya@yuliyalys.com · Instagram @yuliyalys.realestate
How this report was prepared
- Source: MLS® data for the Yaletown sub-area of Vancouver West, covering condos and townhouses. Parking stalls, storage lockers and moorage were excluded.
- Period: sales from September 1, 2025 to September 30, 2026; active listings as of October 13, 2026.
- Sales include deals reported as pending. Recent months may be revised slightly as late sales are reported.
- Withdrawn listings were matched to later relaunches by unit address. Withdrawal dates were estimated from list date plus days on market.
- Months of supply compares active listings with average monthly sales over July to September 2026.
- Medians based on fewer than 10 sales should be read as directional.
- Sources: Greater Vancouver Realtors, Stats Package, September 2026; BNN Bloomberg, October 2, 2026.